

 Joe Hutchings
Innovate and Remain Human
At the very end of 2021, I attended a conference in Wellington, NZ, called Innovate. It was hosted by Public Sector Network, and presentations were...
We recently had a customer ask our Support Team if we were aware of a reporting capability in M-Files for determining which documents were most frequently downloaded from their website. Their web reporting tool could tell them how often certain web pages were accessed, but no details were available to them on specific file touches.
Fortunately, this type of activity (along with many others) is captured in the M-Files Admin Event Log. While there’s no native reporting functions available for the Event Log, the logs can be exported in an XML format, allowing us to use Excel to conduct some analysis.
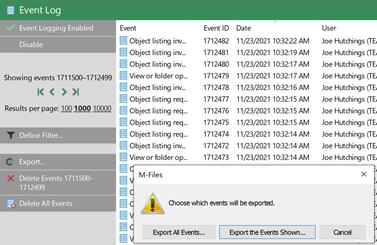
To get started, open M-Files Admin and go to the Event Log. The Export function has options to “Export All Events” and “Export the Events Shown”:
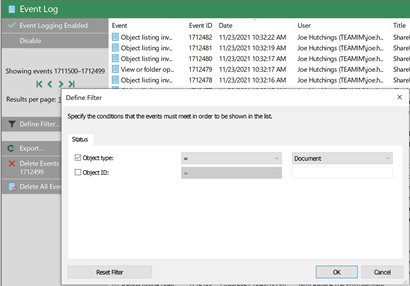
If you want to narrow the event list, you can use Event Log - Define Filter function to include specific Object Types or Object ID’s. Since we’re analyzing document downloads, we’ll filter by Object type “Document.”
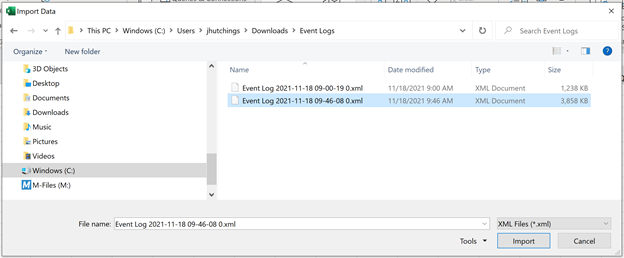
Use the Export Events Shown option to export the events and save them to a drive location of your choice.
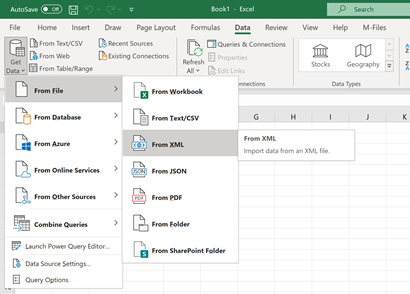
To analyze the log in Excel, start with a new Excel spreadsheet and move to the Data tab. Use the “Get Data” function to import your data” From File” and “From XML” and select the file you exported from M-Files and Import:
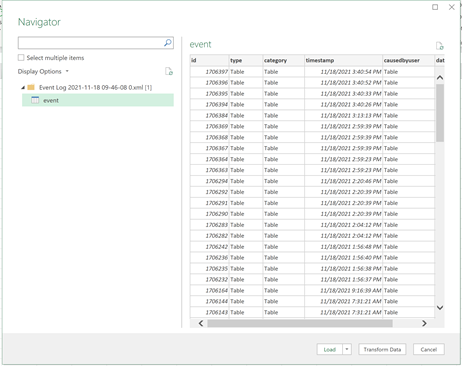
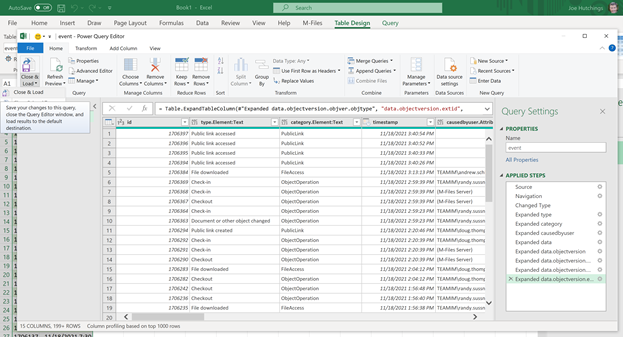
When the data is imported, the Excel Navigator will appear. Select “event” under the Event Log data file (on the left), and you should see a preview of the raw data. Select the “Transform Data” button to open the “Power Query Editor,” which allow us to expand the embedded or collapsed data we’re interested in using:
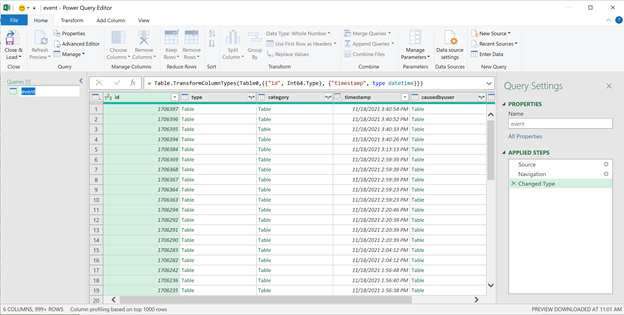
You will see a button with two arrows at the top of column headers with data for expansion such as “type” and “category” in our example:
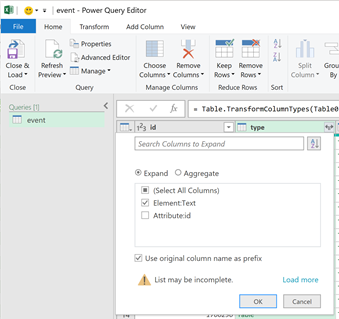
If you expand “type,” you’ll see two sub-columns: Element:Text and Attribute:id. Since we’re only interested in the Element:Text for our analysis, we’ve de-selected the Attribute:id field. Select OK to expand the type column.
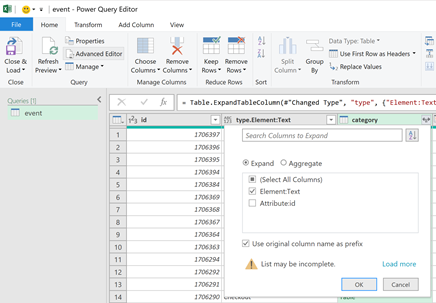
Perform the same steps for the category column and any other columns you’re interested in expanding for your analysis. The column with the most information will be the data column and will likely require two or more iterations of column expansion since the data in the XML file is nested at multiple levels.
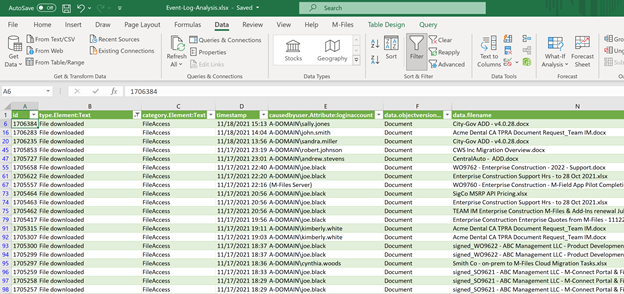
When you’re finished with column expansion, you can load your data by selecting the File tab and Close & Load:
Depending on your dataset size, in a few seconds to a few minutes, the data will be loaded into your spreadsheet with column filters and is ready for all typical Excel functions for your analysis:
While you can certainly use high-end tools like Microsoft Power BI to analyze your data further, most of us have ready access to Excel and are familiar with the methods available to work with columnar-based information. I hope this is helpful and happy data mining!
TEAM IM is a global enterprise solutions and technology company. Utilizing best-in-class technologies to put unstructured data to work, TEAM IM has successfully implemented thousands of business solutions across a diverse spectrum of organizations of varying sizes and industry focus. TEAM IM’s offerings include expert professional services, managed support services, custom development, and solutions in many areas, including Content Management, Records Management, Workflow, Analytics, and Collaboration. TEAM IM has offices across the globe, with resources in every discipline and service offering available to support you, wherever you’re located. More information at teamim.com.
At the very end of 2021, I attended a conference in Wellington, NZ, called Innovate. It was hosted by Public Sector Network, and presentations were...
1 min read
Last year, M-Files launched a certification program for their partners, and we were among the first to become a certified partner. The certification...