

 Randy Sussner
Migrating M-Files to the Cloud
An alternative to hosting M-Files on-premises is the M-Files Cloud. Compared to on-premises deployment, M-Files Cloud provides scalability and high...
The Apache JMeter™ application is open source software, a 100% pure Java application designed to load test functional behavior and measure performance. It was originally designed for testing Web Applications but has since expanded to other test functions.
Source
JMeter is a very effective tool to create test scripts that can be executed against a web application. The script that is created to test the application can include the following:
Creating a script in JMeter is not a difficult task, but it can be a bit cumbersome, especially as web applications are becoming more asynchronous in nature. Calling the URL of a page in a web application does not guarantee that all the logic being executed is included. As the page loads, potentially several REST calls can be made to various targets to load date, perform updates, etc. JMeter supports scripting REST calls, but each individual REST call must be created by adding a HTTP Request to the transaction controller in JMeter, including defining any parameters and/or the body of the request.
BlazeMeter is an open source based, enterprise ready platform that unifies all shift left functionality: Performance Testing, Functional testing, Load testing, etc.
Source
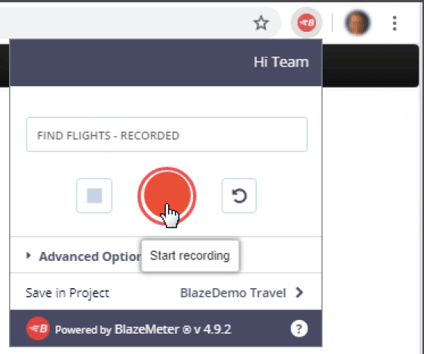
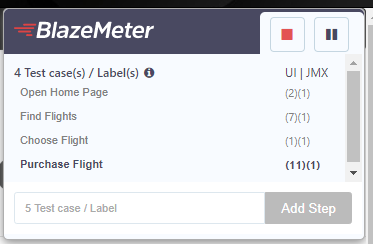
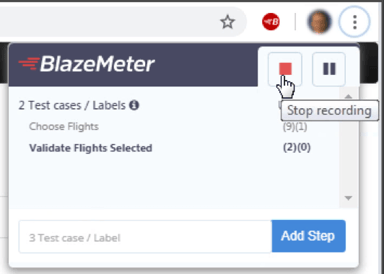
What BlazeMeter allows you to do is ‘record’ a test script via the Chrome browser plugin. After recording the test case directly against the target web application, you can simply download the resulting JMeter script. Following are the simple steps to create your load test script using BlazeMeter:
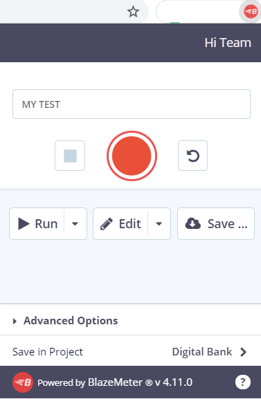
Once you’ve created the script and downloaded the JMX file using BlazeMeter, you can open this script in JMeter. From the example screenshot below, you can see that the HTTP requests have been successfully added to the script, removing the need to create these manually.
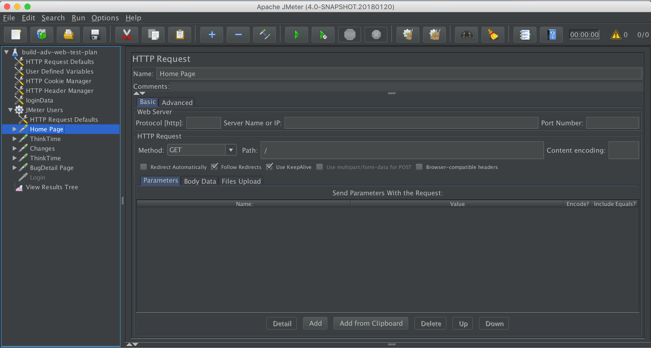
From here, you can tailor the script to meet your testing needs
TEAM IM strives to ensure the quality, security, and performance of our code based deliverables. We have been using J-Meter for years to perform, stress and scale tests our code on all our client projects (see Implementation services) and in the development process of our own products like M-Connect, Modern UI, Field Services, AutoRedaction, and AutoRecords. The introduction of BlazeMeter has made it so much easier and faster to record J-Meter scripts making it faster to produce the Performance test harness, but also importantly providing the flexibility to re-record scripts quickly when the web application changes over time.
These tools are used in conjunction with a range of other quality measures like security, vulnerability, and quality code scans that make up our automated deployment pipeline(s).
TEAM IM is a global enterprise solutions and technology company. Utilizing best-in-class technologies to put unstructured data to work, TEAM IM has successfully implemented thousands of business solutions across a diverse spectrum of organizations of varying sizes and industry focus. TEAM IM’s offerings include expert professional services, managed support services, custom development, and solutions in many areas, including Content Management, Records Management, Workflow, Analytics, and Collaboration. TEAM IM has offices across the globe, with resources in every discipline and service offering available to support you, wherever you’re located. For more information, visit our website.
An alternative to hosting M-Files on-premises is the M-Files Cloud. Compared to on-premises deployment, M-Files Cloud provides scalability and high...
In recent news, Austria’s data regulator found that websites using Google Analytics are in breach of GDPR laws in the European Union.
Are you developing a .NET application using C# and need the ability to send custom emails? Look no further. One of the beauties of .NET is the bounty...